Derivation of spatio-temporal usage patterns using geo-referenced information from social media.
The work package aims at a German-wide and methodologically harmonised analysis of water-related recreational activities. Type, frequency and dynamics of recreational activities and usage densities will be spatially differentiated.
WP 1.1: Evaluation of usage patterns and contents of social media
Many people use social media on a daily basis and leave behind a lot of data, whether consciously or unconsciously. Mostly these are used by companies to find out, for example, how well an advertising campaign is going, how often the company name or logo is used. In the AQUATAG project we want to find out what added value the data from Twitter and Strava could have for the management of our waters.

Twitter is an increasingly relevant communication tool. In the AQUATAG project we take a closer look at the 5.3 million users in Germany. In doing so, we analyze the spatial and temporal distribution of tweets and their dependence on e.g. air temperature or water properties.
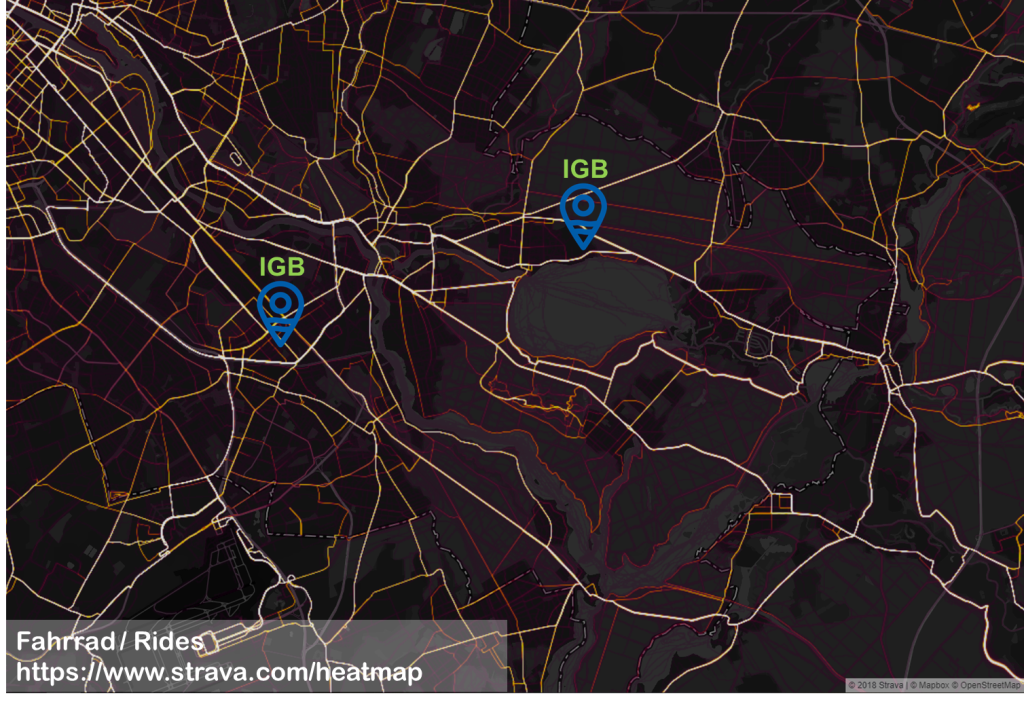
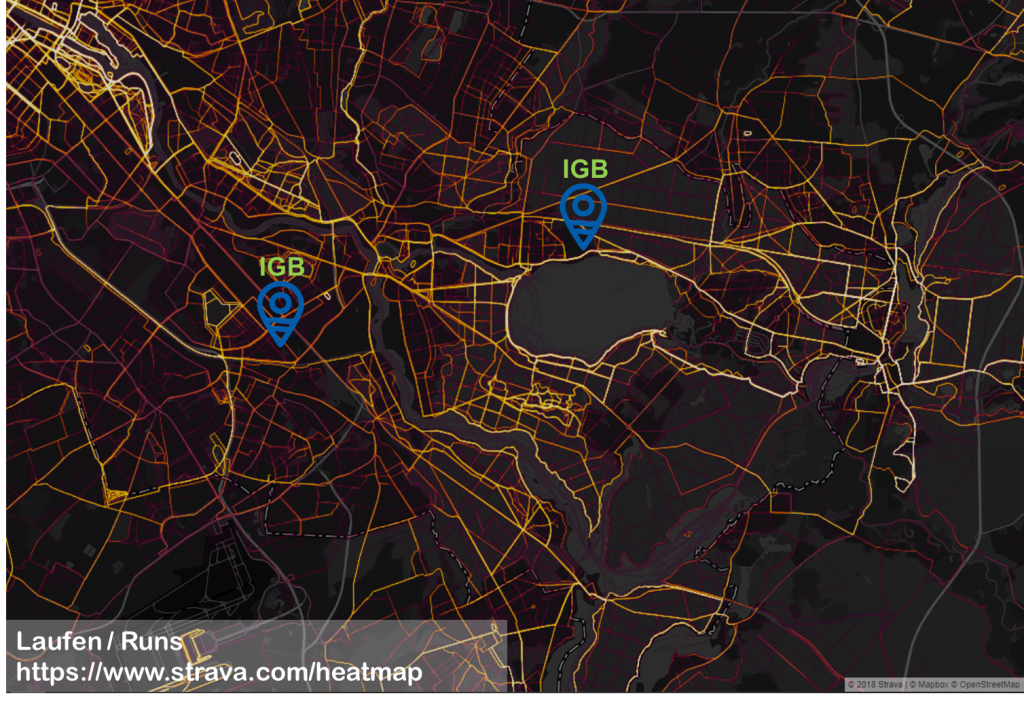
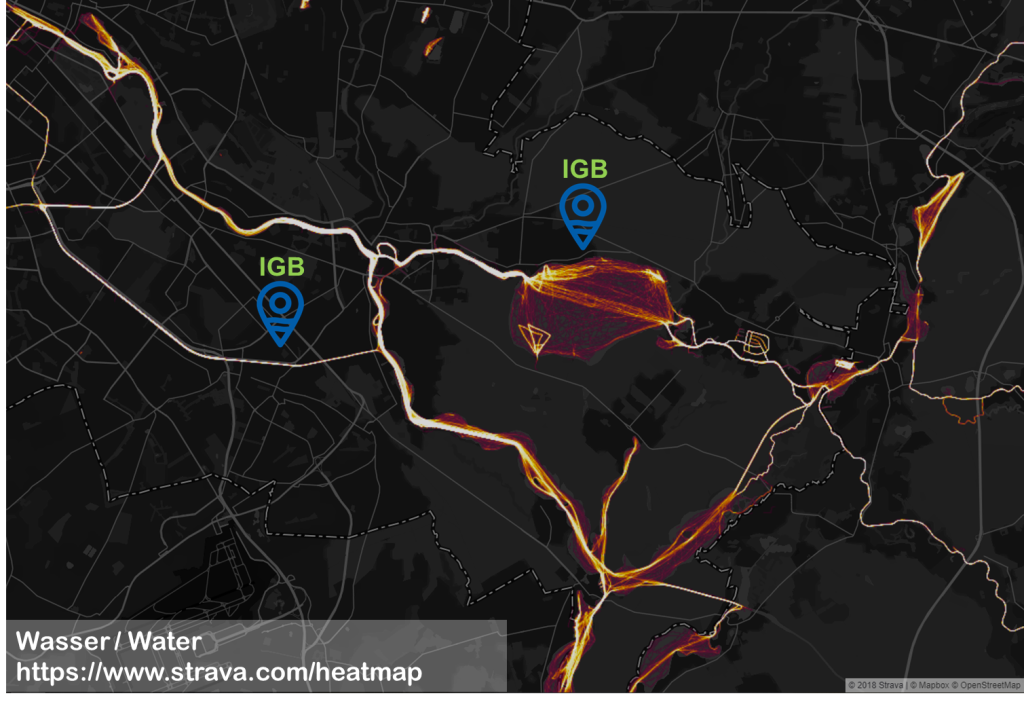
When it comes to running and cycling, STRAVA is one of the most popular apps. The STRAVA heat maps (see pictures around our IGB locations in Berlin) impressively show the usage densities for the different activities. Meanwhile there are many more specific activities that can be tracked with STRAVA as well as activities on the water that are analyzed intensively within the project.
WP 1.2: German-wide surveys on the recreational use of freshwaters
WP 1.3: Evaluation of the statistics collected and provided by associations involved in the project on the activities of their members.
 |  |  |
